Unix Performance Fundamentals
By Jeff Kubler
Kubler Consulting
www.proaxis.com/~jrkublerPhone: 541-745-7457
When investing money in the stock market every investor is obviously there for one reason -- TO MAKE MONEY! Who makes money? Well in today. s market everyone who diversifies and stays in for the long haul makes money. However, people usually envision, or at least would hope, for a much larger and quicker return. Very few do, and for those who do, how do they do it? They make money by understanding certain fundamentals, or leading indicators that allow them to see something before it happens. In the same way the good system manager can learn to understand certain fundamentals and anticipate future changes. This way the system manager can be prepared beforehand with the additional resources necessary to meet demand or the new configuration or tuning that will allow continued adequate performance.
INTRODUCTION
This paper, "Unix Performance Fundamentals", will cover the four basic global areas of system performance. These will be discussed in order to provide an understanding of how they work, what metrics help evaluate their functionality best, what "rules of thumb" can use to determine when they are being over used, and what tuning tips will help get the most out of the system?
Any successful information services department must evaluate performance. Companies, which experience growth often, find that demand now exceeds supply. When response time is no longer acceptable it is often too late to avoid a period of user complaints before the appropriate resource can be upgraded or reconfigured. Even in companies where growth is not a big factor there will be changes in the environment, normal degradation in data structures, and problem processes that need to be addressed. Performance management is the key to keeping the level of hardware resources appropriate to the demand. It is also the key to keeping performance acceptable on a system that is not bottlenecked on a global resource.
Performance Management begins with understanding. Once the functionality of the four basic areas is understood there is a readiness to apply this knowledge to overall planning of resources, problem and crisis performance of specific applications and processes, and the identification of global bottlenecks.
BASICS
The first understanding of importance is the Response Time. This is the time between when a user makes a request and when the computer (really, the entire system -- network, disks etc.) are able to return the request. Response times are the bottom-line measurement of the job of the computer or IT manager. However, response times have proved to be difficult measurements due to the network. The computer can only measure that which it receives and sends out. End-to-end response time measurements, that include the time it takes to traverse the network, are very difficult to find. Because of this difficulty system resources become the best evaluation tool of system performance and response times. Obviously, when response times are too slow, users complain, those complaints work their way up or down the corporate food chain and finally land with a bite on you. Then questions of response lead to questions of management and resources. Everyone wants to avoid this feeding frenzy. That. s why some type of system monitoring needs to take place. Otherwise you may find that some resource is close to saturation or has already reached a point of saturation. A common discussion used to explain what can happen to a resource is that of the "Knee in the Curve". Basically, a resource can be fine and yet highly utilized. Until one more request is made and suddenly that resource is over taxed. Response will increase suddenly once the "Knee in the Curve" area is reached. .
PERFORMANCE MONITORING TOOLS
Once you have determined to monitor performance there are a number of ways to proceed. One option is use the commands that are part of the UNIX operating system. Commands capable of providing helpful information and part of the UNIX operating system are listed below:
top -- shows the top 10 CPU users including a breakdown of user utilizations. Also includes a total of CPU usage, memory usage and CPU Queue Length information.
ps -- (option -ef) shows individual process information.
nfstat -- shows total network statistics.
netstat -- gives a breakdown of network packet activity including ICMP, UDP, TCP, and IGMP activity.
vmstat -- this displays CPU activity, free-memory information, paging, trap rate, and disk transfer data.
iostat -- provides information about disk usage.
sar -- provides general information, which can be collected into reports, reported on graphically, etc.
Here is a sample of the top command
Load averages: 2.31, 1.74, 1.54
102 processes: 100 sleeping, 2 running
Cpu states:
LOAD USER NICE SYS IDLE BLOCK SWAIT INTR SSYS
2.31 90.8% 0.0% 9.2% 0.0% 0.0% 0.0% 0.0% 0.0%
Memory: 8272K (5988K) real, 19100K (14528K) virtual, 2184K free Page# 1/8
TTY PID USERNAME PRI NI SIZE RES STATE TIME %WCPU %CPU COMMAND
? 1730 root 235 20 448K 184K run 420:18 65.89 65.78 _mprosrv
? 4615 root 168 20 1272K 520K sleep 245:01 25.25 25.20 _progres
? 1563 root 128 20 480K 216K sleep 432:17 2.04 2.04 _mprosrv
? 6187 root 48 0 1732K 1788K sleep 2:30 1.01 1.01 lpsmid
? 961 root 154 20 8K 16K sleep 188:53 0.93 0.93 nfsd
This process services NFS requests from remote systems.
? 962 root 154 20 8K 16K sleep 185:05 0.91 0.91 nfsd
? 956 root 154 20 32K 40K sleep 185:28 0.91 0.90 nfsd
? 957 root 154 20 8K 16K sleep 187:26 0.90 0.90 nfsd
? 7 root -32 20 0K 0K sleep 67:26 0.32 0.32 ttisr
d1p0 6309 root 178 20 208K 308K run 0:00 0.33 0.29 _mprosrv
? 0 root 127 20 0K 0K sleep 71:35 0.21 0.21 swapper
? 1407 root 154 20 180K 0K sleep 71:35 0.22 0.22 swapper
? 2 root 128 20 0K 0K sleep 18:55 0.21 0.21 vhand
? 1411 root 156 20 180K 68K sleep 6:32 0.15 0.15 _mprshut
Other third parties including Hewlett-Packard have developed programs to monitor performance. HP offers the following:
GlancePlus -- on-line performance monitoring.
PerfRX -- used to study historical data. Works with MeasureWare.
LaserRX -- like PerfRX but runs on a PC.
Sarcheck - analyzes the output of sar, ps, and other tools, and then reading more information from the kernel. It then identifies problem areas, and if necessary, recommends changes to the system's tunable parameters.
Lund Performance solutions offers a suite of several products. Here is a run down:
SOS/9000
SOS/9000 is an on-line performance monitoring and diagnostic utility for HP-UX systems. SOS/9000 uses either graphical displays or tabular (numeric) to depict how CPU, Disk, Memory, Network and more resources are being utilized.
SOS/9000 obtains most of its information about system usage via the kernel, through a process called
lpsmid. This process is initiated as part of the startup of sos/9000.SOS/X
SOS/X is the GUI front end to the observing on-line HP-UX performance data. SOS/X presents the performance data collected via the
lpsmid process using the X-window environment.Performance Gallery and Performance Gallery Gold
Performance Gallery is the historical analysis tool used to take collected data and present various graphs for analysis. Performance Gallery runs on Windows 3.1, Windows95, Windows98 or Windows NT. Performance Gallery Gold runs on Windows95, Windows98 or Windows NT. There are over 40 pre-created graphs with the ability to create more.
Analysis using extra-UNIX tools
Once either SOS/9000 or Glance is launched a Global Screen appears. In SOS/9000 this screen has two modes. One mode shows the global information as a graphic view and the other showing the numeric or tabular view. Glance uses the graphic only for global information. The screens are divided into sections. Some examples being Global, Process and Performance Advice sections. Either product has a performance advice section that seeks to interpret measured values into English statements. The performance advice sections have configurable thresholds and warning messages can be redirected to logons or to OPENVIEW. The process section breaks out the active processes into their individual processes. In SOS these are sorted by CPU percent. And the Global Section details the usage of CPU, Queue Lengths, Memory percentages used and disk I/O information. Pressing the "Screen Menu" function key in SOS or the function keys in either SOS or Glance can access more screens.
Having worked for some time with the Lund Products I begin with a sample of from SOS. Figure 1 shows a screen shot from within the SOS Global screen. The process information in Figure 1 is sorted by workloads so all of the associated types of activity are sorted together.
Figure 2 - Global sos/9000 Screen
Figure 3 shows a Glance main screen with a similar setup for displaying first a global section followed by a process listing area. The process listing is in separate pages that can be looked through with the biggest CPU user being listed at the top of the first page.
Both SOS and Glance begin with a main screen. Additional screens can be referenced by going to a function key (older versions of SOS), a screen containing letter choices representing screens, or by directly imputing a letter.
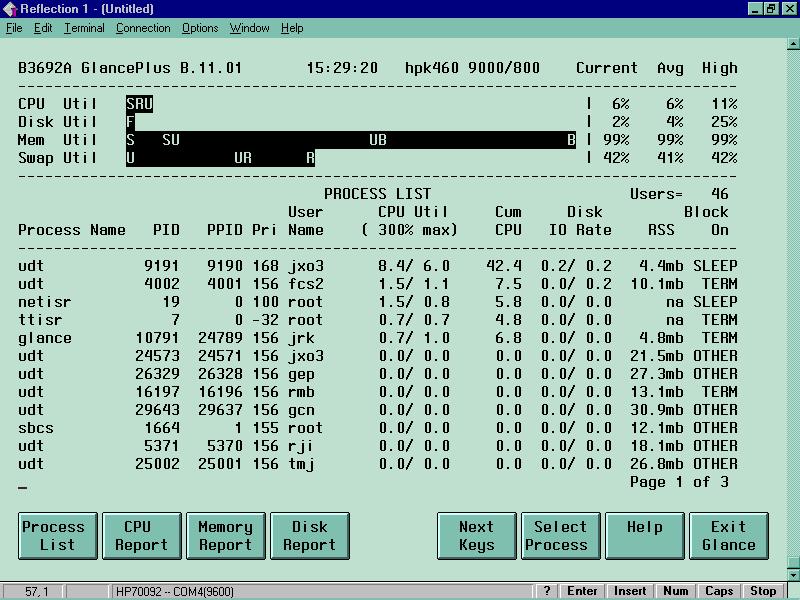
Figure 2 . Glance Main Screen
Data Collection
The analysis and presentation of graphics images depicting the systems performance values cannot be given too little importance. It is greatly helpful in observing immediate problems and in seeing trends over the long term.
Performance Gallery and Performance Gallery Gold are Lund tools that looks at historical data. Performance Gallery begins with collected data. A process called soslogd must be started to collect resource usage data. The collector comes with the on-line tool, SOS Performance Advisor. Once data has been collected over a period of time, the program soslogx is used to pull performance gallery data out for use and evaluation.
PerfRX and LaserRX are two HP products that create graphs of historical data. PerfRX replaces LaserRX.
SARCHECK uses the already inherent application called sar to collect performance data. SARCHECK than reads through the collected log looking for periods of time when a metric was under stress due to demand. It then reports this is a document that appears as a report to the user.
Measurement Information
CPU ANALYSIS
The CPU (Central Processing Unit) performs all of the processing that occurs in the computing environment. Total CPU usage is a good place to start when evaluating system usage. Obviously, when all of the CPU is used you are out of that resource. However, in another sense if the usage executing on the system happens in several priorities the system will be able to manage better. This assumes that some of the processes executing do not demand as fast response time as others (these may be NICED -- or have their priorities lowered). You can check the CPU makeup by looking at either the horizontal bar graph (in SOS or Glance) or by looking at numeric numbers (SOS, Glance, Top, etc.). Processes executing with a 20 nice value are executing without an adjustment to their priority. Processes with a value less than 20 are executing with a "Not Nice" value and those with a value greater than 20 have been "Niced". "Not Nice" processes have had their priority increased to help their processing complete faster while those with a "Niced" value have had their ability to compete reduced. Since the scheduler allows multiple processes to access the CPU by time slicing each contending process the priority of each process is a key element in determining when a process will complete. Other indicators of importance when looking at a process priority are the "R" priority. There are two types of priorities, Real and Time-Share. Most user priorities are time-share. High priority system processes are "Real Time" and so are described by the letter "R", these priorities continue with the CPU until they are either complete are can. t process (the processes are not ready). The different processes running with different priorities are an important point of understanding in looking at the CPU usage. Within SOS they are classified as: U = User; S = System; I = Interrupt; N = Nice; X = Nnice; C = Context Switching; and T = Trap (a Lund reference referring to a software interrupt). The Figure below on the right hand shows the breakdown. When a process must give up the CPU the CPU saves that process in a context and switches to the other. An Interrupt is a hardware event used to stop CPU processing. This can be simply to change priorities or some more ominous problem. A Trap is a software event. Figure 4 breaks down the makeup of the CPU usage under the heading "CPU UTILIZATION". The "CPU MISC" box shows other metrics of importance such as the RUNQ.
Figure 3 . Global CPU
The Run Queue should be another top indicator of CPU problems. The count in the run queue shows how many processes are awaiting the attention of the CPU. The higher the number of processes awaiting the CPU the worse the bottleneck. When the "5 minute run queue" maintains a consistent average in unacceptable ranges your bottleneck is very significant and occurs most of the time.
In Figures 2 and 3 above under the "Process Statistics" section the "Pri" column shows the priority of the process. The "Nic" column shows the Nice value, which is used by the scheduler to help determine the priority of a process. A NNICE or not nice process is given an even greater ability to contend for CPU time by a Nice value that takes it above the normal user value. Figure 2 and 3 are the main sos/9000 screen.
The priority of a process is a dynamically recalculated
(by the statdeamon) value assigned initially into different groupings based on
whether the process is a highly important system process or a user process. The
Scheduler give a process, by default a 1/10 of a second. It divides this into
ten ticks and calculates the user priority every 4 ticks according to this
equation: Newpri = (("recent CPU usage"/a constant) + basepri + nice value)).
Figure 4 . Process Priority Recalculation
In the figure below the following rules apply: Real Time execute at highest priority, are important system
processes and pre-empt lower priority processes running until they complete or sleep; Time Share are time sliced every 1/10 sec, made up of system and user and can be pre-empt or will pre-empt lower priority process in the same category.
When processes are of the same priority, round robin
scheduling is used. Figure 5 describes the HP-UX scheduling prioritization.
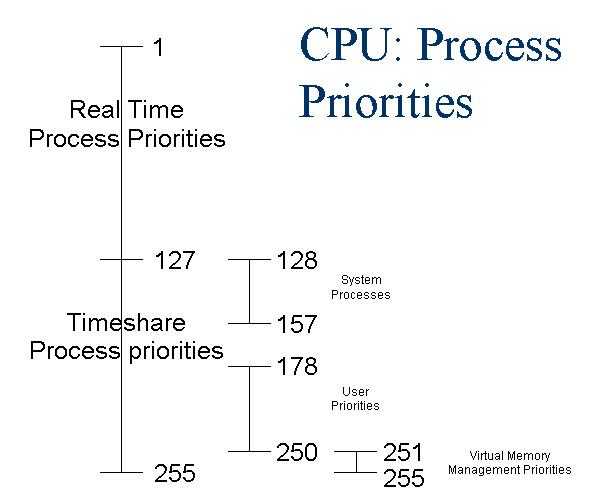
Figure 5 ---HP-UX Process Priorities
Memory Analysis
Memory acts as the work area or "scratch pad" for all of the done on behalf of a process. Because memory is limited a number of strategies are used to try to limit the number of I/O. s to disk. This is because disk is much slower than memory access. Read. s and writes are buffered, and paging and deactivations (or swapping) are used to move unused memory to disk (virtual memory). More memory is usually the cure for a shortage but configuration issues such as the size of the buffer cache are also possible solutions.
Key indicators of memory performance help evaluate how many disk reads and disk writes are eliminated; the percentage of memory and virtual memory in use; the numbers of pages of memory being moved to virtual storage; the percentage of memory and virtual memory in use; and the number of processes that have been deactivated (swapped to disk). When a process begins to execute its needed data must be moved into memory. Since memory is finite there can come a time when no available memory exists. When this occurs the memory manager acts to move pages of space filled with pages that have not been accessed recently out to an area of disk reserved for virtual storage (virtual memory). When memory becomes very short the memory pages of an entire process will be moved, or "swapped" out to virtual storage (the term used in 9.04). This means that the entire process is "deactivated" as its memory pages are sent to disk and it is removed from the Ready Queue (this is what happens at 10.0 and above). When memory becomes very short a process can actually spend most of it. s time "trashing" or looking for available memory. These memory events begin to happen when the thresholds in the figure below are violated.
|
Small memory systems (<= 32 MB) |
Large Memory Systems (> 32 MB) |
Very Large Memory Systems (>2 GB) |
|
|
Lotsfree |
1/8 of FREEMEM not to exceed 1 MB |
1/16 of FREEMEM not to exceed 32 MB |
Not to exceed 64 MB |
|
Desfree |
1/16 of FREEMEM not to exceed 240 KB |
1/64 of FREEMEM not to exceed 4 MB |
Not exceed 12 MB |
|
Minfree |
1/2 of DESFREE not to exceed 100 KB |
1/4of DESFREE to exceed 1 MB |
Not to exceed 5 MB |
Figure 6 - Memory Explanation
Figure 6 shows the levels of total memory available at which memory management events take place. Values for both small memory systems, large memory systems, and very large memory systems are shown. Paging out of memory pages begins when the level of available memory falls below the level of LOTSFREE. Deactivations or swapping of entire processes pages begins when the level of free memory falls below DESFREE. And finally, when MINFREE is exceeded the system will refuse to allocate any more memory until the memory management processes have found more memory.
Even though the measurements of buffer efficiency are listed under disk I/O metrics it is helpful to bring them up under the memory discussion. How much space is configured for the buffer cache removes that much space from general memory availability. The buffer cache is again a place within memory where some of the most recent I/O. s are buffered in the hope the having these close at hand will reduce future I/O. At the 10.X level these configuration items for the size of the buffer (which is allocated from within the total memory) went from a static size to a size dictated by a minimum and a maximum values (DBC_MIN_PCT and DBC_MAX_PCT). This was intended to allow the buffer pool to grow with demand and shrink back so it does not get in the way of the general demand for memory space. There have been reports with problems in the dynamic buffer caches ability to shrink back quickly enough to allow needed memory storage.
Disk I/O
Disk provides long term storage user and system data. In order for a process to access data a disk I/O request must be made to retrieve the needed data. Data that is inefficiently placed in files or data structures will cause the I/O to be much slower than it could be. Several disk I/O requests may arrive at the same disk drive, files may be fragmented, tables and indexes may have their own inherent inefficiencies and disk hardware may be slow. When these problems exist requests will wait in the disk queue. Of course the net impact of this is that processes don. t complete as quickly as they could and users response times are impeded and slowed.
Disk also provides an area on disk called Virtual Memory. This is an area that can be used to move less active memory pages (this process is called paging). Without this capability new processes might not be able to start until memory freed up. Swap space can be defined as system or device swap space (device swap is the faster of the two) or it can be defined within a specific file system. The first step in this process is called Paging. Memory is allocated in increments of pages. When pages are brought into memory (a step in starting a process) or out of (a step which is used to make room for new processes) it is called paging. Once the demand for memory becomes more serious the pages assigned to an entire process can get moved out to virtual memory. At operating system version 9.04 this process is called Swapping. At operating system 10.0 this process is called Deactivation.
A common issue we have observed is that many sites have a data hot spot. One disk, or file system will hold the files where a majority of I/O hits. This is illustrated in the graphic below (note: graphic from LUND PERFORMANCE SOLUTIONS Performance Gallery product . See
www.lund.com for more details).
Figure 7 --- Disk I/O by Drive
Other metrics of importance are the disk I/O queue length, the disk utilization percentage, the total disk I/O count, the wait or pause percentage (available on 9.04) and the buffer cache efficiency values for reads and writes. The disk I/O queue length is the most consistent value and indicates the number of disk I/O requests awaiting service. Obviously, the lower this value is the better. The disk utilization value tells, over an interval how busy an individual disk device is. Having a disk device operate above 20 or 30 percent means that the device is getting too much activity to be effective. The total disk I/O count may indicate that there are simply too many I/O. s for the environment to handle. The wait of pause percentage is a measure of the percentage of wait on I/O processes are encountering. The buffer cache efficiency values tell how much I/O is being reduced because data being found in the buffer. Therefore, disk I/O was not required.
Network
Evaluating the Network is difficult at best. One good way of determining whether or not your systems slow response is due to networking issues is to determine if the application that seems slow is networked or not. If these slow applications are networked in nature then the network is probably the culprit. If the application can be run without the network this can be a clear test for network troubles. If the non-networked application runs acceptably then the network is the problem.
In networking, several protocols are at work when data is being transmitted across the network. The basic transmitted data is referred to as an INTERNET PROTOCOL (IP) datagram. These consist of IP components and User Datagram Protocol (UDP) components. These together with the SNMP message make up the packet. Therefore, graphically we can represent the number of IP packets transmitted and the number of UDP packets sent. The IP component contains the addressing which directs the packet to the right host. The UDP address directs the packet to the correct destination or process within the host. The IP count and the UDP count normally have a one for one relationship. In other words whenever there is a message there will normally be both an IP component and a UDP component.
Another type of message is the INTERNET CONTROL MESSAGE PROTOCOL (ICMP). This type of datagram reports any errors in processing datagrams as well as controlling the flow of traffic on the network.
Finally, another type of message uses Transmission Control Protocol (TCP). This type differs from the types discussed previously. These types are what is called "connectionless", there is no guarantee that they will be delivered. In contrast, the TCP type is termed reliable stream delivery. This type of transmission requires acknowledgement from both the sender and receiver of data before data is sent.
The relationship between the types of activity dictates that every type of transmission must have an IP portion. Therefore, the UDP, ICMP and TCP pieces must add up to the IP count.
A number of issues can be blamed for problems in the transmission of datagrams. Poorly planned and overtaxed networks, shared files on network file systems, and inadequate hardware, can all play parts in poor network performance. Several different metrics help identify performance problems on a network. While packets in and packets out, errors in and errors out, for several different types of transmissions can be measured the clearest measurement is that of the percentage of collisions. Collisions are a measure of how often data transmissions from several stations collide and then must be resent. Any number of collisions that calculates to 10 percent or more of the total network packets transferred is considered high and some examination of the network should be undertaken to try and identify and correct the problem.
How do we analyze the network activity to identify what the problems may be? Look at the total traffic and compare the traffic counts to the errors and collisions. The following graph helps show the network difficulties (note: graphic from LUND PERFORMANCE SOLUTIONS Performance Gallery product . See
www.lund.com for more details).

Figure 8 . Network - IP Packets/Errors
The normal traffic of IP transactions is 100,000,000 transactions per second.. The errors in do not exceed 10,000 transactions per second. Therefore, the percent of errors to the total number of records in or out is acceptable. Records out error percent is zero and records in error percent is 10,000 / 100,000,000 = .0001. Figure 9 shows the types of datagrams counts that are available for evaluation from with Glance.
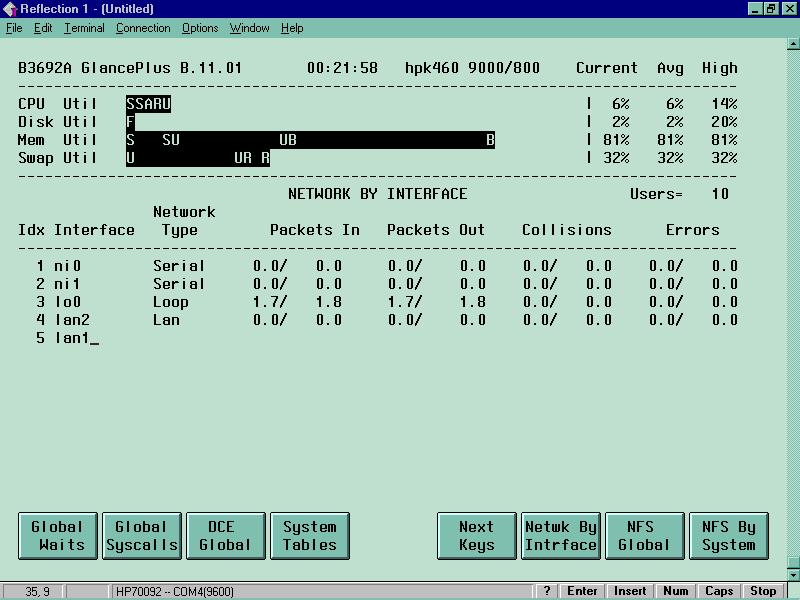
Figure 9 . Network by Interface
The packet errors in and errors out are a measure of errors on the network interface. A large number may mean that hardware is faulty. This can indicate that on computer is generating packets improperly or that a bad connector or terminator is at fault. The percentage of packet errors in or packet error out should be very small. A value of 0.025 percent or less.
Fixes for problems include checking the integrity of the network, dividing it into more subnets, enhancing it. s transmission capabilities and reducing the load.
Analysis Points
Once there is a basic understanding of the measured values some "rules of thumb" can be used to help evaluate global system issues. "RULES OF THUMB" are generally accepted threshold values used by most performance literate users and found to be valid through the experience of many. Mike Loukides book, System Performance Tuning, is loaded with "rules of thumb" embedded throughout the book. Robert Lunds book, Taming Unix has both a discussions of the "rules of thumb" or "Pulse points" as he refers to them in the book and a nice summary in Appendix B (on page 141). On the next figure a breakdown of these helps set a threshold for easy evaluation of problems. "Pulse Points" is another way to refer to "rules of thumb".
Common Metrics for "Rules of Thumb" or "Pulse Points" with explanations
Some the defined items have changed as operating systems have changed. Here is a quick explanation for each item:
Total CPU (%) --
This is the total usage on the system. This measurement is a percentage value from 0 to 100 %.A generally accepted "rule of thumb" is that anything above 85 percent may be an indication of trouble.
Interpretation Hints:
If you suspect CPU saturation you should keep an eye on this number. It may point to batch jobs and processes that need to be "niced" to a lower priority.Run Queue Average --
This statistic shows the average number of executable processes that are waiting to use the CPU for this interval. There may be a slight difference among your measurement tools with regards to this metric when it comes to multiple processor systems. Some tools show the average number of processes per processor, others will show the total. If the total value is say 15 and you have a three processor system you will be more concerned about a CPU bottleneck if you know it is 15 per processor than if it is a total of 15 that really averages to 5 per processor.5 Minute Run Queue Average --
This statistic shows the average number of executable processes, which are waiting for the CPU over the last 5 minutes.The following four items will usually grow together. As the system gets busier more Interrupts occur to satisfy needed hardware events, more context switches occur as new processes get the CPU, more system processing has to occur to keep on needed system activity and more real processing occurs as higher priority system activity must be processed.
Generally anything over 10 percent on the individual measurement deserve a closer look.
Real processing (%) --
Real is the CPU time spent servicing "real-time" user process? These are processes, which run at high (often-fixed) priority.System Processing (%) --
This is the percentage of time the CPU spends executing system calls or operating in the kernel mode.Interrupt (%) --
This is the percentage of time the CPU spent on interrupt and overhead.interrupts - allow for changing from process to process. These interrupts cause the CPU to interrupt and shift priorities.
Context Switching (%) --
This is the percentage of time the CPU spent managing process switching.context switching - after a process run for a quantum (by default 1/10th second) until the process completes or is pre-empted to let another process run. The CPU saves the status of the first process in a context and switches to the next process. The first process drops to the bottom of the run queue to wait for its next turn.
Capture Ratio --
This statistic is a ratio of how much real useful system work is being done compared to the non-useful system work (overhead). The equation for this ratio is as follows: (User + Real + Nice)/(System + Interrupt + Context Switch) = Capture ratio. If the Capture ratio is low you may have a very busy system and a great deal of system activity has to be performed on behalf of the user demands. The more time you spend on system the less time on the user. You could also have a very quiet system. There is a level of system activity that must go on regardless of the demand. A value of 3 or more is good; values of 1 may be a sign of trouble.Page Outs/Second -- This statistic represents the number of times (per second) that a page out is performed to move the least needed pages from memory by writing them to swap space or to the file system. This happens when physical memory becomes scarce. A value of 10 page outs per second is a sign of trouble.
Deactivations -- This statistic represents the number of processes swapped out of memory to disk. This is an indication of the number of processes that have been moved to disk and removed from the CPU queue. A value of 5 is a definite problem.
Memory (%) --
This is the percentage of memory used. Values of 90 percent or greater are trouble. Watch this when it gets to 80 percent. As this gets busier, it will push more activity to the virtual memory.Virtual Memory (%) -
- This is the percentage of virtual memory used (or swap space) and tells how much of this area on disk is utilized. This area gets used when demand for memory space is high. Watch this when it gets above 50 percent and definitely when it gets above 80 percent.Read Hit (%) -- This value represents the percentage of time that disk read requests were satisfied in buffer cache, versus having to satisfy read-type I/Os physically from disk. The buffer cache is not always used as in the case of raw I/O. The Read Hit percentage should always be high. It may not be as vital if you are not using file system I/O but even when using raw I/O it is a good indicator to keep high. Values above 95 percent are desirable.
Write Hit (%)
- This value represents the percentage of time that disk writes were performed in the buffer cache instead of resulting in a physical write to disk. This is the companion of the Read Hit percentage and should also be kept high. Values above 90 percent are good.Disk Queue Length
- This statistic shows the average number of executable processes which are waiting to use the CPU for this interval. The number in the bracket is this value since the monitoring began or statistics were reset. Values above 3 point to disaster and values below 1 are desirable.Total Disk Rate/Seconds -- This is the total disc I/Os occurring each second. Total disk I/O is very rarely seen as a problem. It is more likely that, due to disk "hot spots", one or more disk drives may be pushed too hard. Theoretically, a disk can only perform so much I/O and this is what total disk rate/second will measure. Values above 60, per disk, are trouble and probably even above 40 are bad.
Step-by-Step Analysis
Step-by-Step Analyis is intended to give a recommended approach to help identify performance problems. Once familiar with the metrics and processes inherent in the system, the system administrator given the task of evaluating performance needs an approach to looking at performance. The basic process begins by looking at the macro issues and then moving to the micro issues. The macro issues involve looking at the overall CPU usage, memory usage, disk usage, and network issues. If nothing troubling is discovered in this evaluation one then moves to the micro issues. Micro performance issues deal with the database engine, application issues and a myriad of other specific hardware or environment issues.
To begin looking at macro performance issues the CPU is usually the first point of recommended evaluation. The first question is "Is the CPU encountering a CPU bottleneck?" To answer this question look at the Total CPU Busy from the pulse points provided. If this is above the 85 percent threshold, consistently, more evaluation is needed. The next pulse point to note is the HIPRI-BUSY. This is an indication of the makeup of the CPU usage. A higher value of HIPRI-BUSY indicates that little processing is occurring in the "NICEd" area (an area where a processes priority is potentially reduced). If a high amount of "NICE" is use the demand on the CPU, by those "niced" processes, is lower (which is good!). The next pulse point to examine is the count of processes on the run queue. With high demand on the CPU, processes will end up waiting on the CPU. A high count on this indicator is a very strong indication of a CPU bottleneck.
What steps can be taken when a CPU bottleneck is measured? Basically, reducing the demand is probably the best step to remove the bottleneck. Adding to the processing capabilities is also a potential fix along with using scheduling methods (either an application or manual).
Memory is the next line of evaluation in the step-by-step evaluation. The first metric of evaluation is the percent of memory in use. Memory used percentage should not normally exceed 80 percent. Recall that a portion memory, under most circumstances, is allocated to the buffer cache (there are implementations where raw I/O reduces the need for buffer cache). Therefore, normal memory usage should not reach above 80 percent. When memory usage exceeds 80 percent it becomes much more likely that memory pages will need to be swapped to disk. This causes virtual memory activity and thus the second metric, virtual memory percentage in use becomes important. Unmet demand for memory causes more activity and usage of virtual memory.
The next metric to evaluate is the page out rate. This rate is counted in page outs per second and indicates that unused pages of memory are being swapped out to virtual memory (VM). A high count indicates that incoming processes needed pages of memory and pushed present, yet not recently referenced pages out to VM.
Finally, swap outs or deactivations are the most serious memory activity indicating a resource shortage. At 9.04 swap outs indicated that all the pages for a given process where being moved to VM. At 10.X this terminology was changed to indicate that not only where a given processes pages being moved to VM but that the process itself was being deactivated and it was being removed from the count on the ready queue. This is a problem for performance because of the amount of work necessary to start up these processes again.
To solve memory issues the best answer is acquire more. The use of memory (how the buffer cache is allocated) and general issues of data locality optimization are also important in solving memory shortage issues.
Disk is the next area of evaluation. Disk bottlenecks are a very common problem and the issues here are numerous. The choice made in the disk configuration and hardware choice can be or crucial importance. Sometimes you pay dearly for data protection and high availability. In general, disk I/O should be minimized. Needed disk I/O should be balanced between the available disk members. The best and most consistent metric for measurement is the disk I/O queue length. This is the count of disk I/O requests awaiting service. If requested I/O is quickly retrieved, the next request won. t have to wait in the queue. However, disk and file fragmentation, database engine inefficiencies, I/O that is hits hard on a few drives, configuration issues and hardware inadequacies can all lead to a poorly performing I/O environment.
Solving disk I/O bottlenecks can take a number of forms. The database may require unloading and reloading. Additional or more proper indexing may be needed. A re-examination of the usage of disk hardware may be required. A backup and a reload of all files may be required to eliminate fragmentation. This can also be done to effect a change in the logical volume usage even moving to stripping of disks. Additional disk drives may be needed.
Network problems are probably the most challenging area of performance bottleneck identification. The ideal way to begin identifying bottlenecks in the network area is not to wait until bottlenecks occur, but to observe how the network behaves when things seem good. Then changes to the felt "good" can be noted. When you don. t have this capability you have to begin with the percent of collisions, and move to the errors in and out. From there network errors will often require special equipment and often times a different group within the organization to rectify.
If a view of the macro issues related to CPU, memory, disk and network do not point out a bottleneck micro issues must be looked at. Micro issues revolve around programmatic, kernel tuning or application problems. We have run into problems with individual applications were one more user simply overtaxed the database engine. Things of this nature are quite difficult to isolate and that is why a process of elimination is used to move from the macro evaluation to the micro.
Kernel Parameters
Kernel parameters can also have a detrimental impact on performance. Entries that are too small applications will either give errors when run or may run very slowly. Kernel tuning is a topic for another paper.
Database Engine Performance Issues
The database engine is usually one of the most important components of overall performance. In many organizations a Database Administrator will often have the task of optimizing this environment. When there is a DBA it will often be sufficient to make sure that data loads and unloads, re-indexing, etc. are being performed and that they are being performed often enough. When these housekeeping actions are not being performed, or are not being performed often enough or in a proper fashion additional training the database may be required.
Performance Baseline
The term "Performance Baseline" in often used when discussing computer performance. The importance of this term and the vital information it provides cannot be understated. A Performance Baseline is a picture or an understanding of what performance was like when response time was defined as "good" or acceptable. The reason this is importance is due to the enormous number of options, configurations, application and database engines which are in use. This makes profiling of systems a difficult matter. Therefore, knowing what performance is like during periods of "good" performance is very helpful and will help make the identification of performance problems much easier.
Conclusion
The investment you. ve made in computer resources should be considered an important and protected resource. Sometimes our attitude towards these vital resources can best be described as "cavalier". The purchase is made, but no time or software investment is made to insure that the resource will always be more than adequate and that users needs, in terms of response times, availability and reasonability, will continue to be met.
When problems are encountered (usually unexpectedly) a whole process begins to address the problem. Many times this process is much more accelerated than decisions of this nature normally should be and usually much more money is expended to solve the problem than would have been expended had good long range planning foreseen the event and planned for it. Worse, sometimes bad decisions result from this overly stressed decision brought on by bad planning (or lack of planning).
What needs to be done to avoid the pitfalls most data centers find themselves faced with? The first thing that must be done is to have a change of mindset. A realization needs to be made that the area of system performance is important, that someone needs to pay consistent attention to it, and that software resources need to be acquired (or already available software used) to help measure and understand performance. Once there is a mindset change the rest will naturally follow. However, the mindset change usually occurs when it begins toward the top of the organization chart in any company. If you have experienced the needed mindset change you may need to begin some subtle political moves to try to move the change "up the ladder".
Performance Problems
When performance problems occur the monitoring tool can be run to observe performance bottlenecks on-line. However, the proactive approach is to collect data and analyze data looking for leading indicators of impending bottlenecks. Sometimes just the observation is enough to determine a problem in usage that can lead to re-scheduling the activity, a change in resource usage (perhaps a NICE value), or identify programs for re-engineering (for greater efficiency). At other times a global resource restriction may be the root of the problem. In these cases a larger resource may be needed.
To avoid running out of needed resources and to help gain a general knowledge of your HP-UX system usage you should do the following things: